> For the complete documentation index, see [llms.txt](https://quantsedge.gitbook.io/quantsedge-docs/llms.txt). Markdown versions of documentation pages are available by appending `.md` to page URLs; this page is available as [Markdown](https://quantsedge.gitbook.io/quantsedge-docs/terminal/terminal-overview.md).
# Terminal Overview
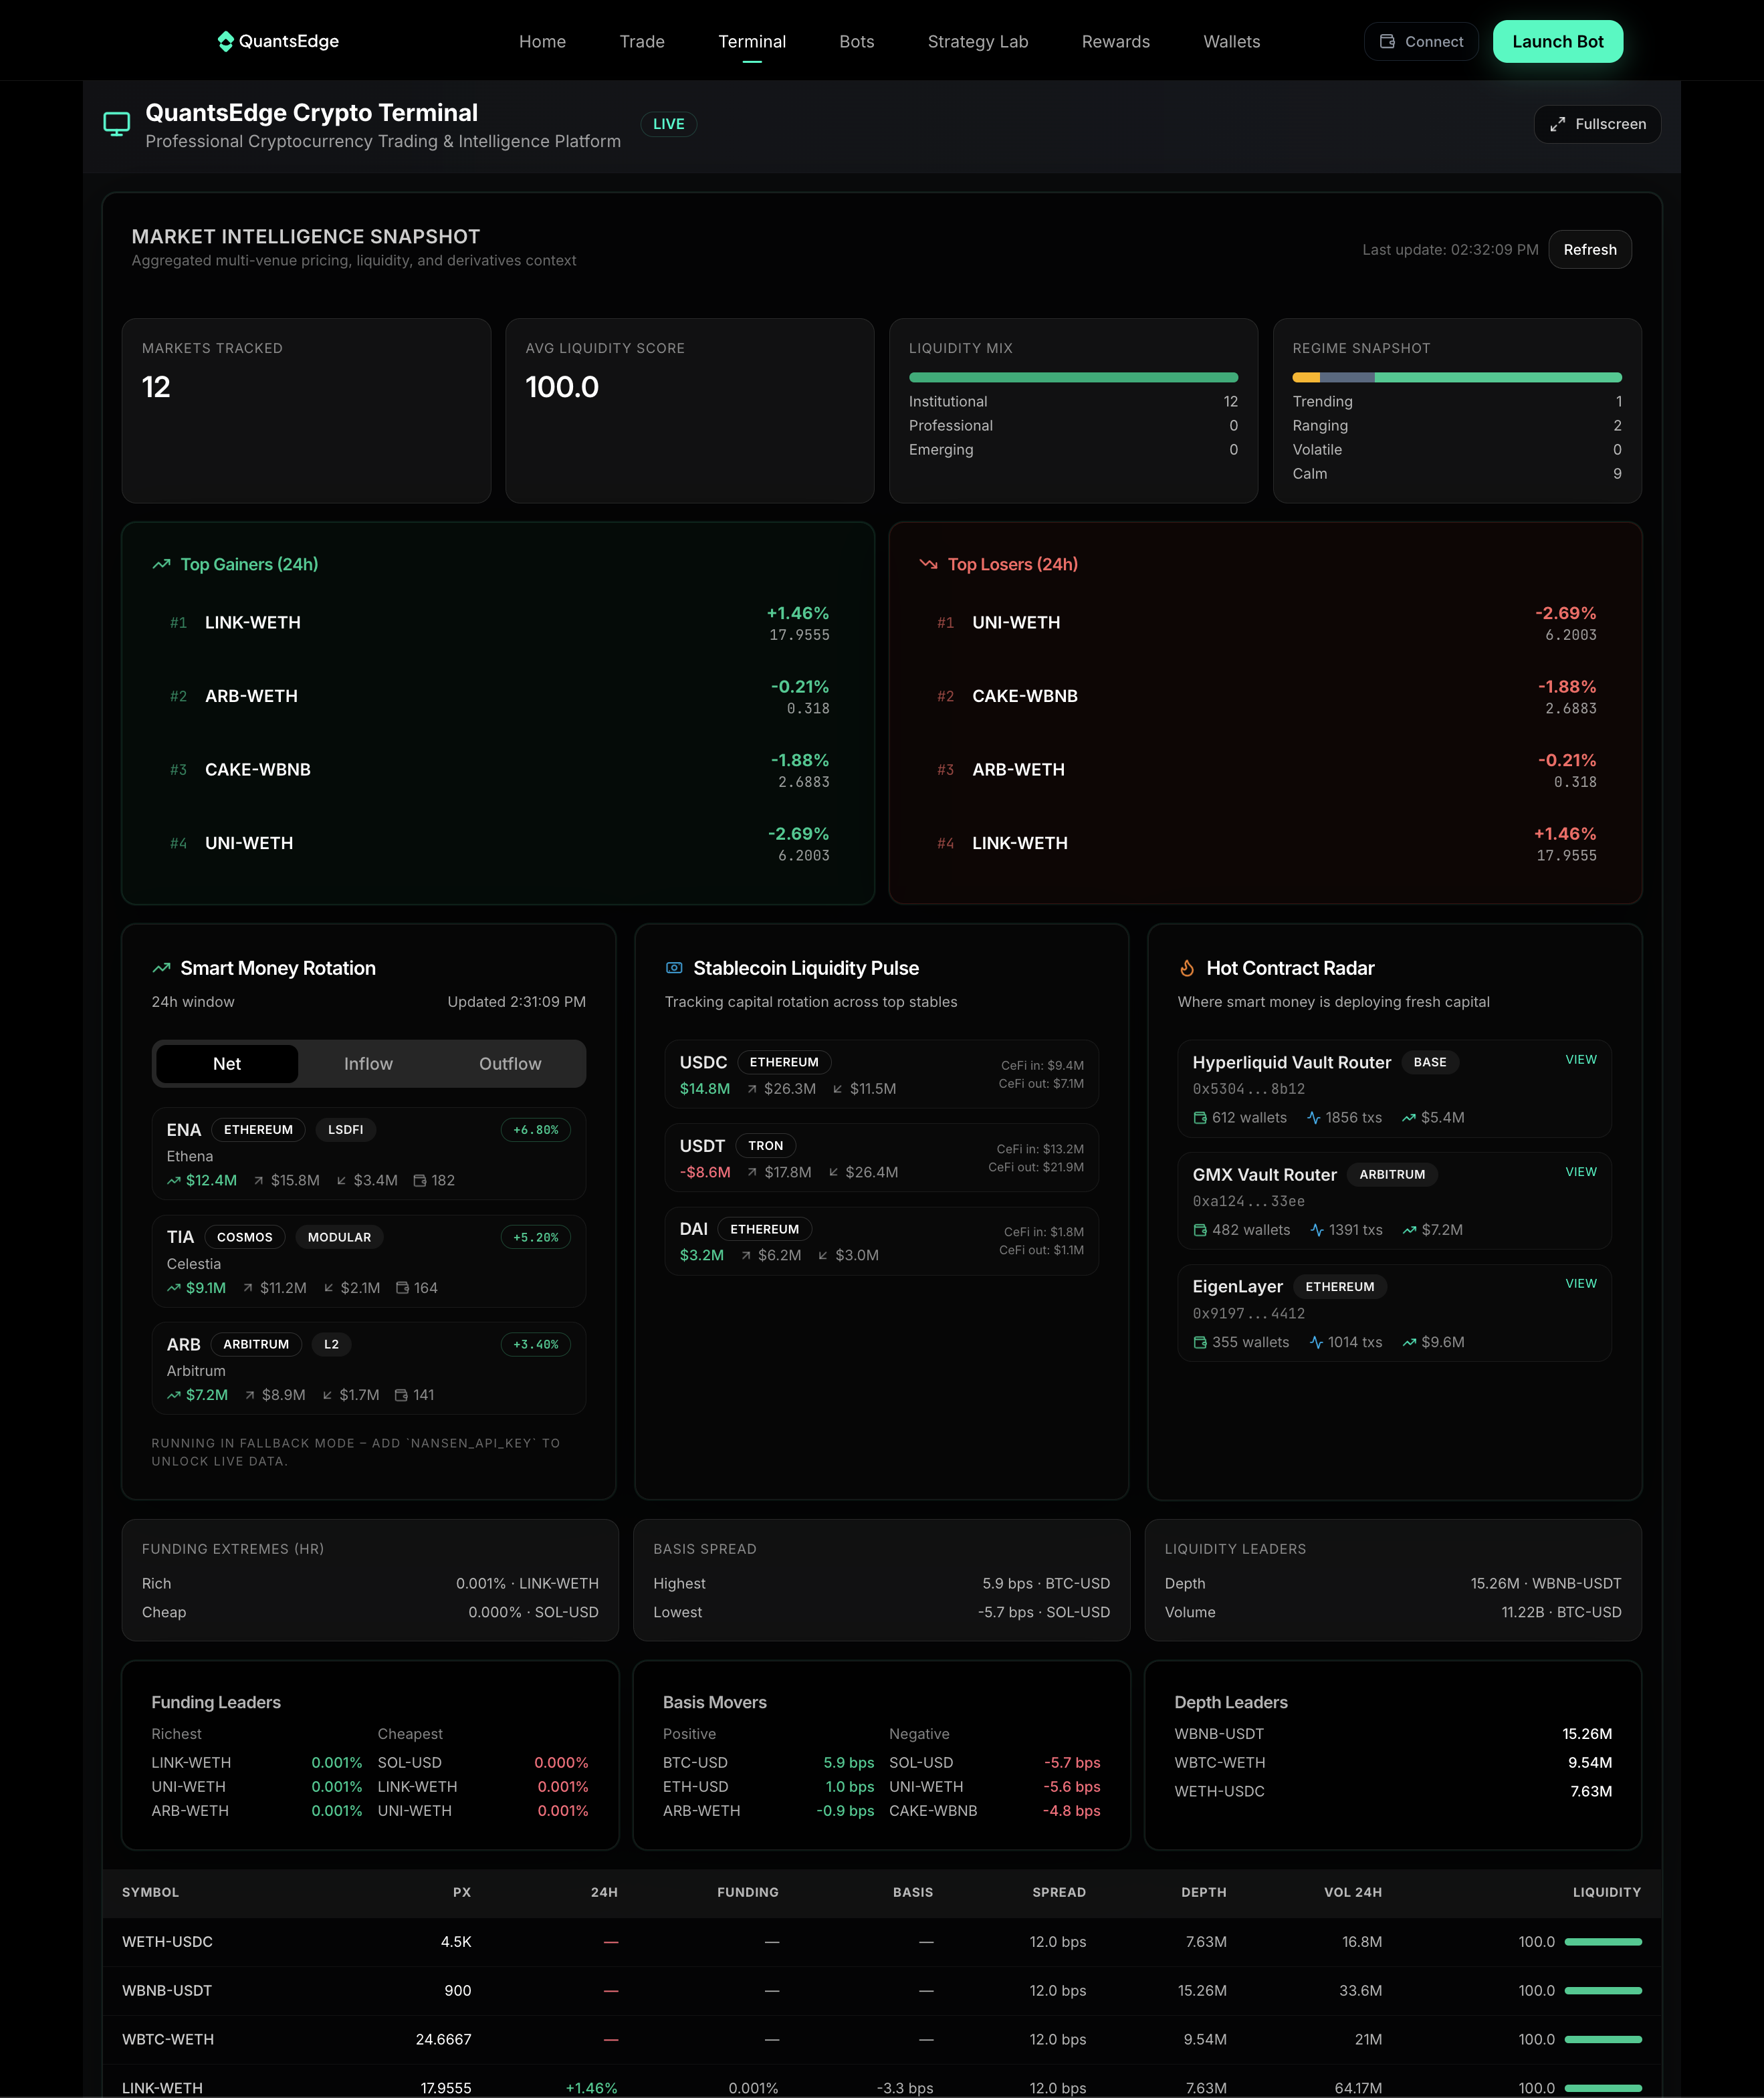
The Terminal is your professional trading workspace, providing institutional-grade tools for market analysis and real-time decision making.
## What is the Terminal?
The Terminal is a professional trading interface designed for serious traders who need:
**Multi-Widget Dashboard:** Customizable workspace with drag-and-drop widgets for personalized trading environment.
**Real-Time Market Data:** Live price feeds, order books, and market intelligence for comprehensive market awareness.
**AI-Powered Analysis:** Machine learning insights and technical analysis for data-driven trading decisions.
**Advanced Charting:** Professional-grade charts with technical indicators for detailed market analysis.
**Market Overview:** Comprehensive market data and sentiment analysis for market-wide perspective.
**News Integration:** Real-time news feeds with sentiment analysis for informed trading decisions.
## Terminal Features
### Professional Trading Interface
Institutional-grade trading tools and analytics:
**Multi-Widget Workspace:** Customize your workspace with any combination of widgets through drag-and-drop layout, adjust widget sizes to match your trading style, organize multiple charts and analysis tools with tabbed interface, and enjoy immersive trading experience with full-screen mode for focused analysis.
**Real-Time Data:** Provides real-time market data for all supported assets, live order book data with depth analysis, comprehensive market depth and liquidity analysis, and real-time volume and liquidity metrics for complete market awareness.
### AI-Powered Analysis
Machine learning insights for better trading decisions:
**Technical Analysis:** Delivers machine learning-powered technical analysis, automatic detection of chart patterns and signals, market sentiment and confidence scoring, and AI-powered risk analysis and recommendations for comprehensive market analysis.
**Market Intelligence:** Provides real-time market sentiment analysis with confidence levels, AI-powered trend identification and strength assessment, machine learning-based volatility forecasting, and cross-asset correlation and dependency analysis for informed trading decisions.
### Advanced Charting
Professional-grade charting with comprehensive technical analysis:
**Chart Types:** Features traditional OHLC candlestick charts, clean price action visualization with line charts, area charts for trend visualization, and OHLC bar charts for detailed analysis.
**Technical Indicators:** Includes moving averages (SMA, EMA, WMA) with customizable periods, momentum indicators (RSI, MACD, Stochastic, Williams %R), volatility indicators (Bollinger Bands, ATR, Standard Deviation), volume indicators (Volume Profile, OBV, Volume Oscillator), and custom indicators for personalized analysis.
**Chart Features:** Supports multiple timeframes (1m, 5m, 15m, 1h, 4h, 1d, 1w), pinch-to-zoom and pan functionality, drawing tools for trend lines and support/resistance, chart annotations for notes, and chart templates for custom configurations.
### Market Overview
Comprehensive market data and analysis:
**Market Intelligence:** Displays biggest gainers and losers with volume analysis, visual representation of market performance through heatmaps, highest volume assets with liquidity analysis, and overall market sentiment and confidence metrics.
**Real-Time Updates:** Provides real-time price updates for all assets, live volume and liquidity tracking, real-time order book and market depth data, and real-time news feeds with sentiment analysis for comprehensive market awareness.
### News and Sentiment
Integrated news and sentiment analysis:
**News Feed:**
* **Real-Time News**: Live news feeds from multiple sources
* **Sentiment Analysis**: AI-powered news sentiment analysis
* **Market Impact**: Analysis of news impact on market movements
* **Filtering**: Filter news by asset, sentiment, and impact level
**Sentiment Analysis:**
* **Market Sentiment**: Overall market sentiment scoring
* **Asset-Specific Sentiment**: Individual asset sentiment analysis
* **Confidence Levels**: Sentiment confidence and reliability metrics
* **Trend Analysis**: Sentiment trend analysis over time
## Terminal Widgets
### Core Widgets
Essential widgets for professional trading:
**Market Overview Widget:** Displays biggest gainers and losers, visual market performance through heatmaps, highest volume assets, and overall market statistics for comprehensive market awareness.
**Advanced Chart Widget:** Features multiple chart types (candlestick, line, mountain, bar), comprehensive indicator library, professional drawing and annotation tools, and support for all major timeframes.
**AI Analysis Widget:** Provides AI-powered technical analysis, automatic pattern detection, market sentiment and confidence analysis, and AI-powered risk assessment for data-driven decisions.
**Order Book Widget:** Shows real-time order book data, comprehensive market depth analysis, liquidity and volume analysis, and key support and resistance levels for order flow analysis.
### Specialized Widgets
Advanced widgets for specific trading needs:
**News Terminal Widget:** Provides real-time news feeds, sentiment analysis, market impact analysis, and advanced filtering for informed trading decisions.
**Portfolio Widget:** Offers position overview, performance metrics, risk assessment, and allocation analysis for comprehensive portfolio management.
**Screener Widget:** Enables asset screening, technical screening, fundamental screening, and custom screens for systematic asset discovery.
**Economic Calendar Widget:** Displays economic events, market impact analysis, event filtering, and historical analysis for fundamental analysis.
## Terminal Navigation
### View Modes
**Grid View:** Multi-asset grid with customizable layout, real-time updates, and quick actions for efficient market monitoring.
**Heatmap View:** Market heatmap with color coding, interactive drill-down, and timeframe selection for visual market analysis.
**Professional View:** Advanced analytics, risk metrics, correlation analysis, and market regime analysis for institutional-grade analysis.
**Order Book View:** Live order book, market depth, liquidity analysis, and price action for order flow analysis.
### Navigation Features
**Tabbed Interface:** Multiple tabs with tab management, quick switching between views, and tab persistence for seamless workflow.
**Breadcrumb Navigation:** Path tracking with quick navigation, context awareness, and history for easy navigation.
**Quick Actions:** Floating action button, keyboard shortcuts, gesture controls, and voice commands for efficient interaction.
## Terminal Customization
**Workspace Layout:** Drag-and-drop widgets with resizable panels, save custom layouts, dark/light themes, color schemes, font sizes, favorites, custom indicators, and chart templates.
**Performance Optimization:** Data caching, update frequency control, memory management, network optimization, rendering performance, animation settings, and resource monitoring.
## Mobile Terminal
**Touch Interface:** Gesture controls with touch optimization, haptic feedback, and biometric authentication for secure mobile access.
**Mobile Widgets:** Responsive design with mobile charts, quick actions, and offline mode for mobile trading.
**Performance:** Battery optimization, network adaptation, memory management, and background updates for efficient mobile operation.
## Getting Started
**Quick Setup:** Access Terminal → Choose Layout → Add Widgets → Customize → Save Layout
**Best Practices:** Logical widget grouping, consistent layouts, essential widgets visible, appropriate update frequencies, data quality, backup configurations, regular maintenance
## Next Steps
Ready to start using the Terminal? Here's what to do next:
1. [**Strategy Lab Overview**](/quantsedge-docs/strategy-lab/overview.md) - Learn about strategy development and testing
2. [**Dashboard Overview**](/quantsedge-docs/trading-bots/dashboard-overview.md) - Understand the main trading dashboard
3. [**Mobile App Overview**](https://github.com/quantsedgeai/app/blob/wonk/docs/guides/mobile-app-overview.md) - Learn about mobile trading features
4. [**Performance Analysis**](/quantsedge-docs/strategy-lab/performance-analysis.md) - Analyze your trading performance
The Terminal provides everything you need for professional trading analysis and decision making. Start with the basic widgets and gradually build your expertise.
***
**Related:** [Strategy Lab Overview](/quantsedge-docs/strategy-lab/overview.md) | [Dashboard Overview](/quantsedge-docs/trading-bots/dashboard-overview.md) | [Mobile App Overview](https://github.com/quantsedgeai/app/blob/wonk/docs/guides/mobile-app-overview.md) | [Performance Analysis](/quantsedge-docs/strategy-lab/performance-analysis.md)
---
# Agent Instructions
This documentation is published with GitBook. GitBook is the documentation platform designed so that both humans and AI agents can read, navigate, and reason over technical content effectively. Learn more at gitbook.com.
## Querying This Documentation
If you need additional information that is not directly available in this page, you can query the documentation dynamically by asking a question.
Perform an HTTP GET request on the current page URL with the `ask` query parameter, and the optional `goal` query parameter:
```
GET https://quantsedge.gitbook.io/quantsedge-docs/terminal/terminal-overview.md?ask=&goal=
```
`ask` is the immediate question: it should be specific, self-contained, and written in natural language.
`goal` is optional and describes the broader end goal you are ultimately trying to accomplish on behalf of the user. GitBook uses it to tailor the answer towards what is most useful for that goal.
The response will contain a direct answer to the question and relevant excerpts and sources from the documentation.
Use this mechanism when the answer is not explicitly present in the current page, you need clarification or additional context, or you want to retrieve related documentation sections.